

Data Science & Statistical Data Analysis with R Program offers a comprehensive exploration of data analytics using the R programming language. From data preprocessing and exploratory data analysis to predictive modeling and machine learning algorithms, the R program provides hands-on experience and practical insights into the application of data science methodologies. In this context, the Human Resource Development Center in collaboration with the School of Liberal and Creative Arts (Social Sciences & Languages) organized the ‘Short Term Course on Data Science & Statistical Data Analysis with R Program’ w.e.f April 04, 2024 to April 10,2024.
The course aimed at developing the capacity in the basic concept of R, data visualization, probability, and normal distribution, correlation and simple linear regression analysis, Chi-square test, comparing mean t-test, and analysis of variance.
Dr. Sunaina Ahuja, Professor and Dean, Head – Human Resource Development Center (HRDC), LPU the convener of the program, warmly welcomed the participants and mentioned that this program will equip participants with the essential skills and knowledge required to manipulate, analyze, and visualize data effectively. Various statistical techniques and tools with R will enable the participants to uncover insights and make informed decisions. Moreover, she expressed confidence that the course’s deliberations and hands-on learning will help participants to develop tangible skills in Statistical Data Analysis with Dr. Manish Verma, Professor and Head, Department of Psychology, School of Liberal and Creative Arts (Social Sciences & Languages), LPU, co-convener of the program, gave an overview of the course curriculum, elucidating its core objectives and significance in advancing knowledge and skill in Data Science & Statistical Data Analysis with R Program. He mentioned that by mastering R for statistical data analysis, participants will gain a competitive edge in today’s data-driven world, opening up diverse career opportunities in fields such as finance, healthcare, marketing, and more.
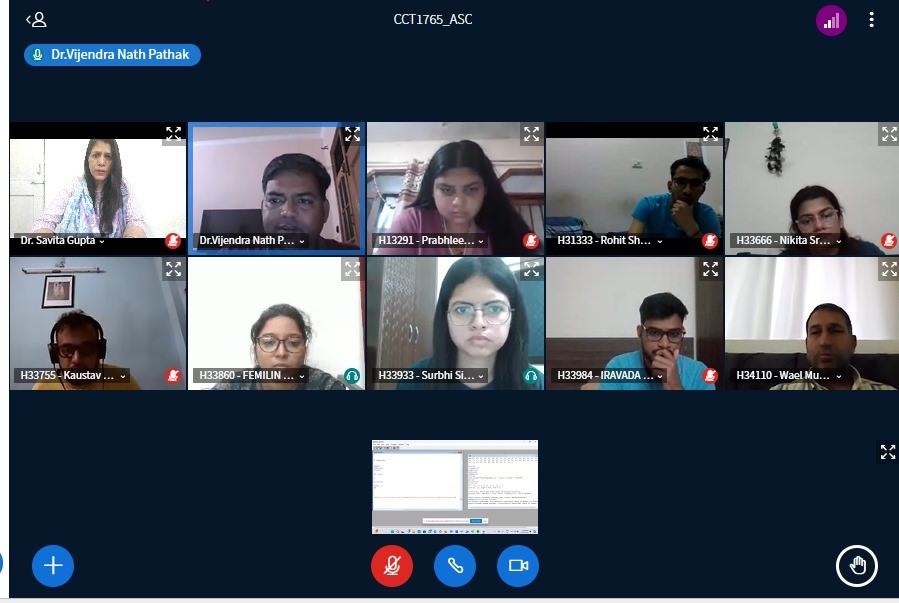
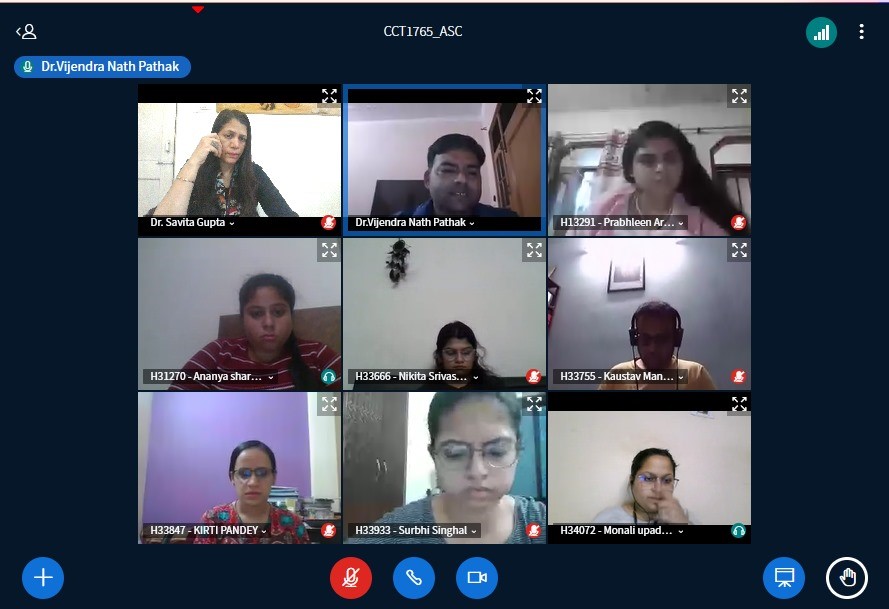
The resource panel included Dr. Nirpeksh Kumar, Associate Professor, Department of Statistics, Faculty of Science, Banaras Hindu University, Varanasi, Dr. Vijendra Nath Pathak, Associate Professor, Department of Psychology, School of Liberal and Creative Arts (Social Sciences & Languages), LPU and Dr. Amita Baranwal, Assistant Professor, Department of Mathematics, School of Chemical Engineering and Physical Sciences, LPU. Day-wise glimpses of the program are appended below:
Day 1: Module 1: R and R Studio
The session commenced with an introduction to R and R Studio by Dr. Nirpeksh Kumar, he elucidated the fundamentals of the R programming language and the R Studio. Participants gained insights into the basics of data, encompassing an overview of basic data types, data structures, and data manipulation techniques in R. Following this, Programming in R was introduced. Dr. Nirpeksh also covered the basic programming concepts like variables, loops, and conditional statements. Import and export techniques for data were discussed, including methods for importing data from various sources and exporting data from R. The session culminated with a Hands-on session, where participants engaged in practical exercises to reinforce their understanding of R and R Studio fundamentals.
Day 2: Module 2: Data Visualization
On day two Dr. Vijendra Nath Pathak focused on Data Visualization, emphasizing its significance in data analysis. Dr. Pathak elucidated Histogram creation in R for visualizing data distributions, followed by an introduction to Pie Charts and their application in representing categorical data. Techniques for creating various types of graphs and plots in R to visualize data relationships were also covered. The session concluded with a Practical Session where participants practiced creating different visualizations using R, gaining hands-on experience.
Day 3: Module 3: Probability and Normal Distribution
Dr. Vijendra Nath Pathak explained probability basics in a clear and detailed way. He showed how important probability theory is in analyzing data. Dr Pathak elucidated about the normal distribution and how much it is important in statistics. Then, he explained the Binomial Distribution and its role in making conclusions from data. He also discussed about other probability distributions and how these are used in different real-life situations.
Day 4: Module 4: Hypothesis Testing
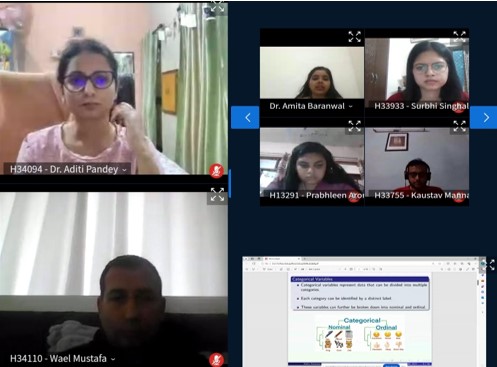
Dr. Baranwal initiated the session with an introduction to categorical data analysis, focusing on the χ^2 goodness of fit and χ^2 test of independence. Hypothesis testing basics were discussed, highlighting its significance in statistical inference. Participants engaged in Hands-on Practice, conducting hypothesis tests using R, with a focus on categorical data analysis.
Day 5: Module 5: Correlation Analysis
Correlation Analysis was the main focus of the day, Dr. Amita Baranwal explained the correlation concepts and its importance in understanding relationships between variables. Further, she demonstrated simple linear regression analysis and its application in predictive modeling was provided. Participants performed correlation analysis and simple linear regression using R with practical datasets in a Hands-on Session.
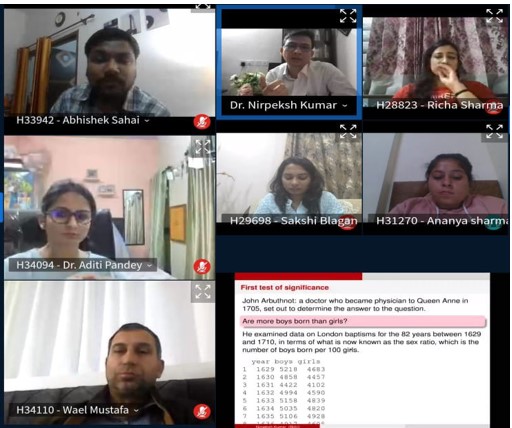
Day 6: Module 6: Tests of Significance
Dr. Nirpeksh Kumar conducted the session on Tests of Significance, providing an overview of different tests including the one-sample t-test and paired-sample t-test. Introduction to Analysis of Variance (ANOVA) for comparing means across multiple groups was also covered. Participants applied tests of significance using R to analyze real-world datasets and draw meaningful conclusions.
Subject Matter Experts (SMEs) strategically included a blend of theoretical instruction, practical demonstrations, and hands-on exercises, ensuring participants gained a comprehensive understanding of the topics covered, and fostering an engaging and interactive learning environment. Post-training evaluation serves a crucial role in gauging the efficacy of the STC. Two types of post-training evaluation both MCQ and project were assigned. Participants were asked to submit an analysis report of the given data sets.
Dr. Savita Gupta, Professor and Head- Department of Faculty Development coordinator of the program applauded the organizing team and resource persons for conducting a meaningful short-term course, successful in meeting participants’ expectations. Co-coordinator of the program, Dr. Vijendra Nath Pathak, Associate Professor, Department of Psychology, School of Liberal and Creative Arts (Social Sciences & Languages), LPU proposed a formal vote of thanks. Feedback was solicited from the participants in response to which they appreciated the gesture shown by the LPU-HRDC in terms of choice of Subject Matter Experts and curriculum framed to make us clear about using of R program for statistical data analysis.


